Emotional Footprint Awards 2024
Business Intelligence & Analytics - Midmarket
SoftwareReviews names Tableau, Microsoft Power BI, Oracle Analytics Cloud, Logi Symphony, Qlik Sense, and Amazon QuickSight as Business Intelligence & Analytics - Midmarket Emotional Footprint Award Winners.
View Category
Business Intelligence & Analytics - Midmarket
Emotional Footprint Awards
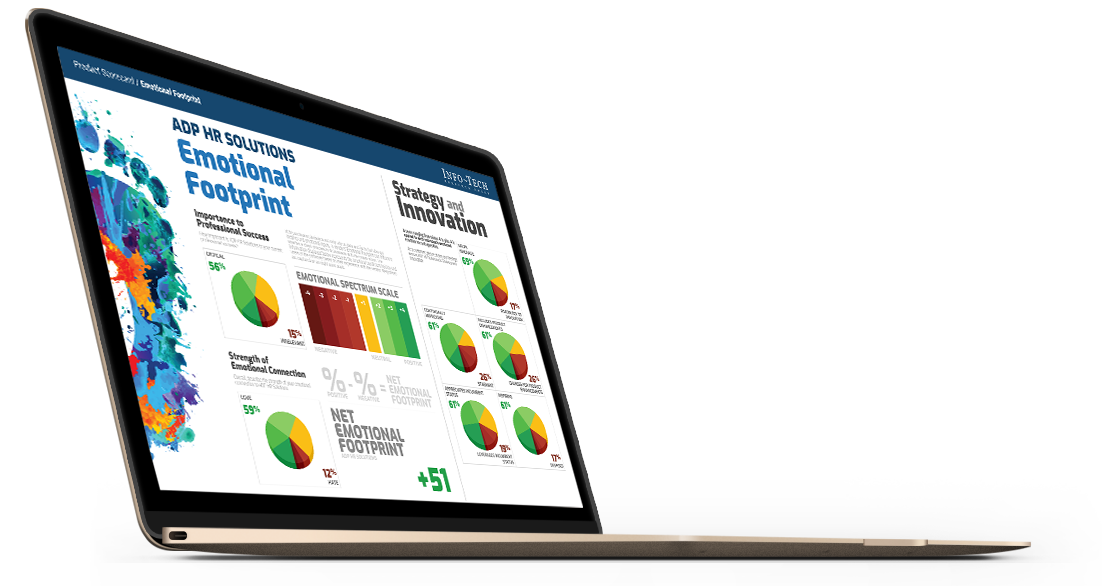
SoftwareReviews Emotional Footprint Awards evaluate and rank products based on emotional response ratings from IT and business professionals. Using our Emotional Footprint methodology, we aggregate emotional footprint scores across 26 dimensions of the vendor-client relationship and product effectiveness, creating a powerful indicator of overall user feeling toward the vendor and product.
Emotional Footprint Awards are proudly founded in 100% user review data and are free of traditional “magical” components such as market presence and analyst opinion, which are opaque in nature and may be influenced by vendor pressure, financial or otherwise.
Read The In-Depth Report
See how each vendor stacks up across each of the 26 dimensions and our thorough evaluation of vendor capabilities, product features, and overall satisfaction.
30+ pages


Measuring Emotional Footprint
Emotional Footprint is scored using our “Net Emotional Footprint” Index. This index tracks responses across 26 dimensions of emotional footprint that span 5 categories: Purchasing, Service Experience, Product Impact, Vendor Strategy, and Conflict Resolution. Then, the following calculation is done across this index:
% of Positive Reviews - % of Negative Reviews
For clarity, the total percentage of positive, neutral, and negative ratings is shown for each vendor as well.
Emotional Footprint Leaders
Salesforce.com Inc
Tableau
Harness the power of your data. Unleash the potential of your people. Choose the analytics platform that disrupted the world of business intelligence. Choose Tableau.
9.0
CX Score
CX
Score
+90
Net Emotional Footprint
Net Emotional
Footprint
88
Value Index
VALUE INDEX
Summary.
Long description.
Structure.
Chart graphic.

394Reviews
Microsoft Corporation
Microsoft Power BI
Power BI is a business analytics solution that lets you visualize your data and share insights across your organization, or embed them in your app or website. Connect to hundreds of data sources and bring your data to life with live dashboards and reports.
9.0
CX Score
CX
Score
+89
Net Emotional Footprint
Net Emotional
Footprint
88
Value Index
VALUE INDEX
Summary.
Long description.
Structure.
Chart graphic.

536Reviews
insightsoftware
Logi Symphony
Logi Symphony (formerly Dundas BI) enables software teams to rapidly design, build, and embed interactive dashboards and data visualizations with fast connectivity and access to modern data infrastructure. Maintain complete control over the analytics experience while empowering end users to explore, analyze, and share data, securely.
9.0
CX Score
CX
Score
+92
Net Emotional Footprint
Net Emotional
Footprint
88
Value Index
VALUE INDEX
Summary.
Long description.
Structure.
Chart graphic.

121Reviews
Oracle
Oracle Analytics Cloud
Oracle Analytics is a comprehensive solution to meet the breadth of all analytics needs. Get the right data, to the right people, at the right time with analytics for everyone in your organization. With built-in security and governance, you can easily share insights and collaborate with your colleagues. By leveraging the cloud, you can scale up or down to suit your needs.
8.9
CX Score
CX
Score
+89
Net Emotional Footprint
Net Emotional
Footprint
89
Value Index
VALUE INDEX
Summary.
Long description.
Structure.
Chart graphic.

86Reviews
QlikTech
Qlik Sense
Qlik Sense is a business intelligence (BI) and visual analytics platform that supports a range of analytic use cases. Built on Qlik’s unique Associative Engine, it supports a full range of users and use-cases across the life-cycle from data to insight – with self-service analytics, interactive dashboards, conversational analytics, custom and embedded analytics, mobile analytics, and reporting. The solution comes in three different editions - Qlik Sense Enterprise, Business, and Team. Qlik Sense can be deployed in the cloud or on-premises.
8.8
CX Score
CX
Score
+87
Net Emotional Footprint
Net Emotional
Footprint
86
Value Index
VALUE INDEX
Summary.
Long description.
Structure.
Chart graphic.

87Reviews
Amazon
Amazon QuickSight
Amazon QuickSight is a fast, cloud-powered business intelligence service that makes it easy to deliver insights to everyone in your organization.
8.7
CX Score
CX
Score
+90
Net Emotional Footprint
Net Emotional
Footprint
82
Value Index
VALUE INDEX
Summary.
Long description.
Structure.
Chart graphic.

47Reviews
Other Evaluated Vendors
Sisense
Sisense
SiSense liberates data, empowers business users and frees IT by making it easy to do the difficult tasks of accessing, joining and visualizing data.
8.5
CX Score
CX
Score
+89
Net Emotional Footprint
Net Emotional
Footprint
85
Value Index
VALUE INDEX
Summary.
Long description.
Structure.
Chart graphic.
82Reviews
Domo
Domo
Domo brings your business and all its data together in one intuitive platform. With Domo, it's easy to see the information you care about in one place and use it to make faster, better-informed decisions.
8.5
CX Score
CX
Score
+86
Net Emotional Footprint
Net Emotional
Footprint
84
Value Index
VALUE INDEX
Summary.
Long description.
Structure.
Chart graphic.
71Reviews
Salesforce.com Inc
Tableau CRM Analytics
Discover the story your data has to tell. CRM Analytics (formerly Tableau CRM) empowers your Salesforce CRM users with actionable insights and AI-driven analytics right in their workflow.
8.5
CX Score
CX
Score
+84
Net Emotional Footprint
Net Emotional
Footprint
85
Value Index
VALUE INDEX
Summary.
Long description.
Structure.
Chart graphic.
70Reviews
IBM
IBM Cognos Analytics
IBM Cognos Analytics offers smarter, self-service capabilities so you can quickly and confidently identify and act on insight. The engaging experience empowers business users to create and personalize dashboards and reports on their own - while providing IT with a proven and scalable solution that is available on-premises or in the cloud.
8.5
CX Score
CX
Score
+88
Net Emotional Footprint
Net Emotional
Footprint
86
Value Index
VALUE INDEX
Summary.
Long description.
Structure.
Chart graphic.
60Reviews
Looker
Looker is a platform for data that streamlines the data supply chain to create actionable information. It allows any organization to extract value from their data at web-scale, delivers powerful purpose built applications to address the needs of specific teams, and provides a flexible, embedded analytics framework with Powered by Looker.
8.4
CX Score
CX
Score
+84
Net Emotional Footprint
Net Emotional
Footprint
83
Value Index
VALUE INDEX
Summary.
Long description.
Structure.
Chart graphic.
75Reviews
MicroStrategy
MicroStrategy
MicroStrategy 10 meets the needs of both business and IT. Make sense of large data volumes, get answers in an instant, build stunning visualizations, and ensure a single version of the truth securely, at any scale, on every device.
8.4
CX Score
CX
Score
+92
Net Emotional Footprint
Net Emotional
Footprint
87
Value Index
VALUE INDEX
Summary.
Long description.
Structure.
Chart graphic.
37Reviews
Yellowfin
Yellowfin
At Yellowfin we are passionate about making Business Intelligence easy. As an emerging software developer on the local and international scene, Yellowfin provides 100% web-based embeddable reporting and analytics.
8.3
CX Score
CX
Score
+91
Net Emotional Footprint
Net Emotional
Footprint
86
Value Index
VALUE INDEX
Summary.
Long description.
Structure.
Chart graphic.
38Reviews
Zoho
Zoho Analytics
Zoho Analytics is a self-service BI and data analytics software that lets you analyze your data, create stunning data visualizations, and discover hidden insights in minutes.
8.2
CX Score
CX
Score
+77
Net Emotional Footprint
Net Emotional
Footprint
82
Value Index
VALUE INDEX
Summary.
Long description.
Structure.
Chart graphic.
158Reviews
SAP
SAP Analytics Cloud
A single solution for business intelligence and collaborative planning, enhanced with the power of predictive analytics and machine learning technology. SAP Analytics Cloud delivers all the analytics capabilities you need – business intelligence (BI), planning, and predictive analytics – in a single solution. Harness the latest technologies and give everyone in your organization the ability to discover actionable insights in real time.
8.2
CX Score
CX
Score
+89
Net Emotional Footprint
Net Emotional
Footprint
87
Value Index
VALUE INDEX
Summary.
Long description.
Structure.
Chart graphic.
35Reviews
SAP
SAP BusinessObjects
SAP BusinessObjects BI is a reporting and analytics business intelligence (BI) platform aimed at business users. It consists of a number of reporting applications that allow users to discover data, perform analysis to derive insights and create reports that visualize the insights.
8.2
CX Score
CX
Score
+88
Net Emotional Footprint
Net Emotional
Footprint
84
Value Index
VALUE INDEX
Summary.
Long description.
Structure.
Chart graphic.
67Reviews
GoodData
GoodData
GoodData is revolutionizing the way companies are providing analytics directly to their customers and partners. Integrating seamlessly into workflows, GoodData provides authenticated access to business reporting, dashboards, and ad hoc analytics that is timely, relevant and customizable to independent users.
7.6
CX Score
CX
Score
+77
Net Emotional Footprint
Net Emotional
Footprint
79
Value Index
VALUE INDEX
Summary.
Long description.
Structure.
Chart graphic.
30Reviews
For the full list of vendors in this space, click here.
Download
Get Instant Access<br>to this Report
Get Instant Access
to this Report
Unlock your first report with just a business email. Register to access our entire library.
© 2025 SoftwareReviews.com. All rights reserved.


Contact Us
Welcome to SoftwareReviews!
Before continuing, please take a moment to review and agree to our policies and indicate your email preferences below:
Please sign in via LinkedIn to access your free .
Signing in also unlocks access to the dynamic version of the Data Quadrant, which plots vendors based on verified user reviews! Customize the Data Quadrant according to the features and sentiments that matter most to you.
Please note: the dynamic version of the Data Quadrant continues to collect data after report publication, and may show new data that will appear in next year's report.
This offer is available until May 31, 2020. These reports are intended for internal strategic use only and are not authorized for redistribution. For permission to reuse content, please contact vendors@softwarereviews.com.


