Customer Experience Awards 2018
Business Intelligence
SoftwareReviews names Dundas BI, WebFOCUS, Tableau, Zoho Reports, and Qlik as Business Intelligence Customer Experience Award Winners.
View Category
Business Intelligence
Customer Experience Awards
The SoftwareReviews Customer Experience Awards evaluate and rank products based on emotional response ratings from IT and business professionals. Our scoring methodology aggregates these ratings across 26 dimensions of the vendor-client relationship and product effectiveness, creating a powerful indicator of overall user feeling toward the vendor and product.
Customer Experience Awards are proudly founded in 100% user review data and are free of traditional “magical” components such as market presence and analyst opinion, which are opaque in nature and may be influenced by vendor pressure, financial or otherwise.
Read The In-Depth Report
See how each vendor stacks up across each of the 26 emotional response areas, and how they compare against each other. Our Customer Experience Report covers all aspects of the vendor-client relationship.
30+ pages
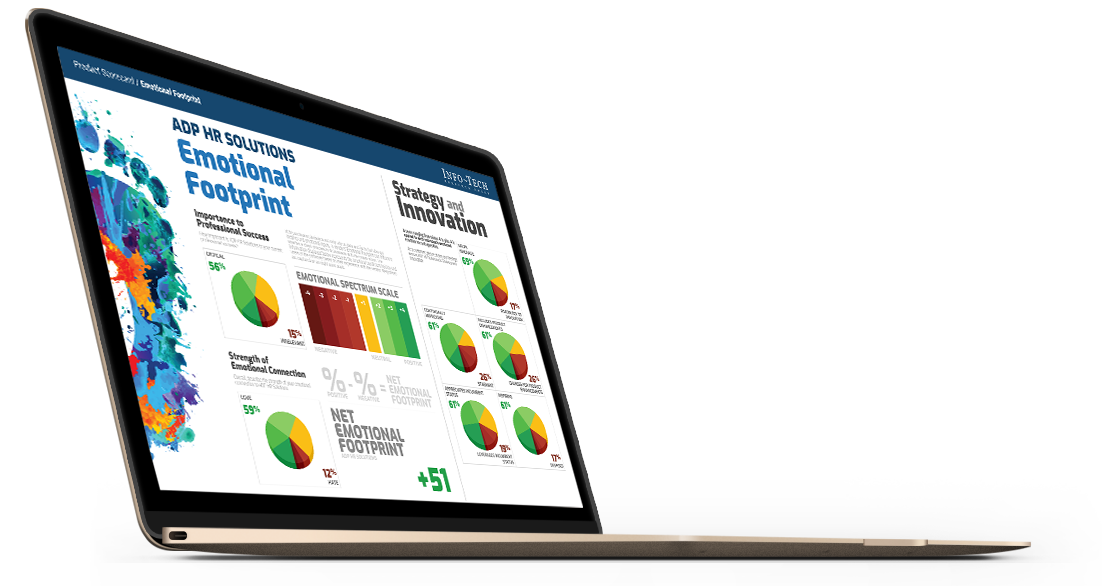
Measuring Customer Experience
Customer Experience Award rankings are scored using our “Net Emotional Footprint" index, which tracks responses across 26 emotional response areas that span 5 categories: Purchasing, Service Experience, Product Impact, Vendor Strategy, and Conflict Resolution. The following calculation is done across this index:
% of Positive Reviews - % of Negative Reviews
For clarity, the total percentage of positive, neutral, and negative ratings is shown for each vendor as well.
Customer Experience Leaders
Dundas Data Visualization
Dundas BI
Dundas BI gives you full control over your data so you can create stunning dashboards, embedded analytics and a personal user experience. Your business gets more than just data exploration, it gets the perfect delivery needed to act on it.
+86
Net Emotional Footprint
Net Emotional
Footprint
Strongest
Positive Emotions
97% Includes Product Enhancements
96% Integrity
94% Continually Improving
Information Builders
WebFOCUS
WebFOCUS is a flexible, scalable, and easy to use business intelligence and analytics platform that offers the right information delivery approach for every kind of user. WebFOCUS delivers rich, consumable, interactive information to the widest range of employees, managers, analysts, partners, and customers.
+79
Net Emotional Footprint
Net Emotional
Footprint
Strongest
Positive Emotions
91% Caring
91% Respectful
91% Efficient
Tableau
Tableau
Data prep for messy spreadsheets, instant analytics, and improved performance. It's smart meets fast.
+78
Net Emotional Footprint
Net Emotional
Footprint
Strongest
Positive Emotions
90% Performance Enhancing
90% Enables Productivity
89% Continually Improving
Zoho
Zoho Reports
Zoho Reports is an online reporting and business intelligence service that helps you easily analyze your business data, and create insightful reports & dashboards for informed decision-making.
+76
Net Emotional Footprint
Net Emotional
Footprint
Strongest
Positive Emotions
100% Enables Productivity
91% Security Protects
91% Reliable
Other Evaluated Vendors
MicroStrategy
MicroStrategy BI
MicroStrategy 10 meets the needs of both business and IT. Make sense of large data volumes, get answers in an instant, build stunning visualizations, and ensure a single version of the truth securely, at any scale, on every device.
+73
Net Emotional Footprint
Net Emotional
Footprint
Strongest
Positive Emotions
91% Respectful
88% Enables Productivity
86% Fair
BOARD International
BOARD
Within one single product BOARD offers all the functionalities needed to build any Business Intelligence Software and Corporate Performance Management application solutions without the use of any programming. Its revolutionary toolkit approach as well as delivering unrivalled speed in BI and CPM application building, customisation and maintenance, provides end-users with an advanced interactive interface. This unique capability turns the self-service creation of any report or analysis into the simplest of tasks.
+73
Net Emotional Footprint
Net Emotional
Footprint
Strongest
Positive Emotions
92% Performance Enhancing
91% Respectful
88% Enables Productivity
TIBCO Software
TIBCO Business Intelligence
TIBCO Software Inc. is a global leader in infrastructure and business intelligence software. Whether it's optimizing inventory, cross-selling products, or averting crisis before it happens, TIBCO uniquely delivers the Two-Second Advantage® - the ability to capture the right information at the right time and act on it preemptively for a competitive advantage.
+65
Net Emotional Footprint
Net Emotional
Footprint
Strongest
Positive Emotions
93% Integrity
93% Enables Productivity
93% Performance Enhancing
SAS
SAS BI
SAS is the leader in business analytics software and services, and the largest independent vendor in the business intelligence market.
+57
Net Emotional Footprint
Net Emotional
Footprint
Strongest
Positive Emotions
82% Transparent
79% Performance Enhancing
79% Enables Productivity
Microsoft
Microsoft BI
Microsoft Corporation is an American multinational technology company that develops, manufactures, licenses, supports and sells computer software, consumer electronics and personal computers and services.
+56
Net Emotional Footprint
Net Emotional
Footprint
Strongest
Positive Emotions
80% Helps Innovate
80% Respectful
78% Continually Improving
IBM
IBM Cognos Platform
The IBM® Cognos® platform is an open, enterprise-class platform that can provide your users with the business intelligence (BI) and performance management content they need to understand your business and help improve results.
+51
Net Emotional Footprint
Net Emotional
Footprint
Strongest
Positive Emotions
80% Enables Productivity
79% Respectful
74% Reliable
SAP
SAP BI
Empower your people with 24/7, user-friendly access to the business intelligence (BI) and Big Data mining tools they need to make faster, more informed decisions. Our BI software and solutions – including ad hoc reporting, self-service data visualization and dashboards, predictive analytics, mobile apps, and more – can help business users improve performance and become more effective in everything they do.
+46
Net Emotional Footprint
Net Emotional
Footprint
Strongest
Positive Emotions
75% Respectful
72% Reliable
72% Performance Enhancing
Oracle*
Oracle BI Solutions
Oracle Business Analytics can help, with new ways to gain business insights through the simplicity of the cloud and data visualization. Sift through any data using visual analytic tools. Pinpoint what matters, then put together a story of your data-driven conclusion. Create powerful data mash-ups and have an actual "conversation" with your data. With visual analytics and data discovery tools, the possibilities are limitless.
+38
Net Emotional Footprint
Net Emotional
Footprint
Strongest
Positive Emotions
87% Respectful
70% Security Protects
70% Performance Enhancing
For the full press release, click here. For the full list of vendors in this space, click here.
Get Instant Access<br>to this Report
Get Instant Access
to this Report
Unlock your first report with just a business email. Register to access our entire library.
© 2025 SoftwareReviews.com. All rights reserved.